Diffusion Adapter Management and Monitoring
August 12, 2021 | Naveena Dhougoda-Hamal
With the 6.7 release of Diffusion™, all the included data adapters (the Kafka adapter, the JMS adapter, and the new CDC adapter) can be monitored and controlled from the Diffusion Management Console of the connected server, or any other server in the same cluster.
Once started, each adapter is visible in the console ‘Network’ tab. An adapter can be started with only a bootstrap configuration required to connect to the Diffusion server. Other configuration details to publish or subscribe to Diffusion topics can be added at runtime as services.
Services
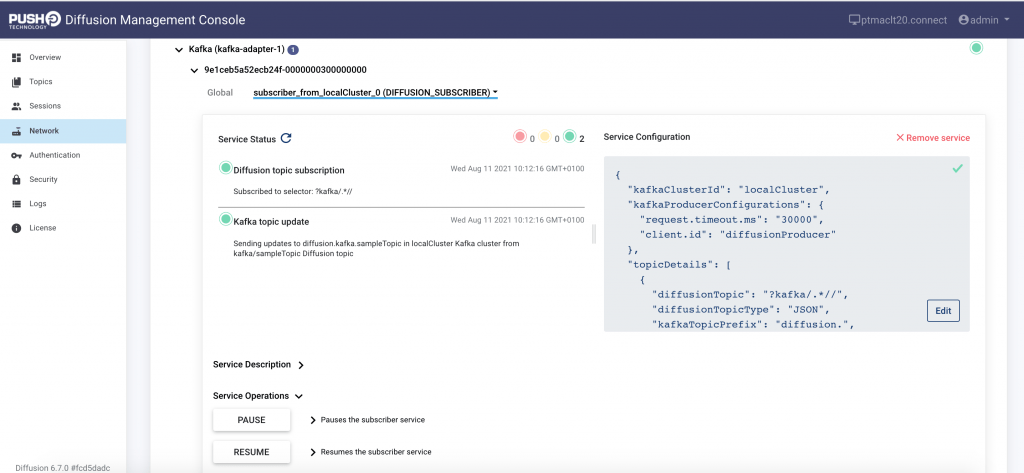
A ‘service’ represents a specific function that an adapter supports. Each adapter defines a set of services; each service has a type, name, description and configuration.
You can view details of the supported services by clicking each connected adapter in the console. The overall configuration of the adapter is defined by the service configurations.
Services can be added, updated, and removed via the Diffusion Management Console, after the adapter has started. If a service is updated while running, the configuration is then persisted by the Diffusion server.
The persisted configuration can be used by not passing a configuration file as an argument on subsequent startups. If a configuration file is passed as an argument when starting the adapter, this is used to start up the services. If a persisted configuration for the specified adapter ID is available on the server, it will be overridden by the contents of the passed configuration file.
Operations
‘Operation’ is a new concept introduced for adapters which allows interaction with adapters via the Diffusion Management Console. Each adapter defines a specific set of operations that it supports. All adapters support operations like ‘Pause’, ‘Resume’ and ‘Shutdown’. Operations are service-specific as well. Most services defined by an adapter support ‘Pause’ and ‘Resume’ operations which allow more granular management of the adapter.
Statuses
You can see the status of each adapter and its services in the Adapters view of the Diffusion Management Console.
The types of status are adapter-specific. They can be related to the status of subscription/publication to Diffusion topics, or the invocation of operations. Each status consists of a title, description and level. The level can be Green, Amber, or Red.
- Green means that the adapter/service is functioning as it is supposed to.
- Amber means that an issue is affecting some aspect of the operation of the service; for example, a particular message may not have been delivered, or the adapter may have been paused.
- Red means that a terminal incident has occurred that is preventing publishing or subscribing to Diffusion topics.
We hope the improved adapter monitoring makes it easier than ever to get your real-time data moving from Diffusion to the other parts of your application. Please don’t hesitate to get in touch if you have any feedback on the adapters, or suggestions for future improvements.


